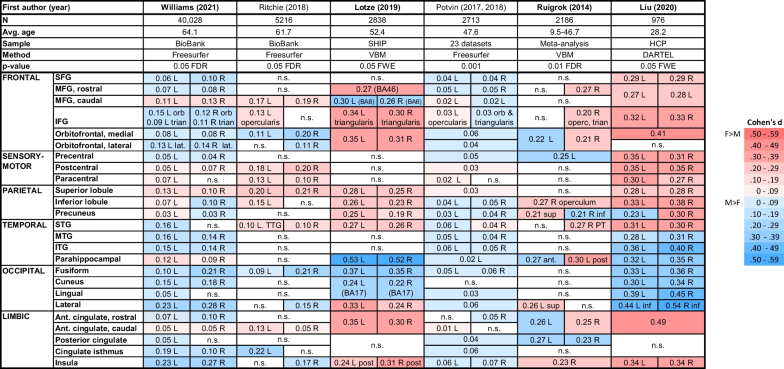
- Tabulation of findings from the six largest studies derived and expanded from Eliot et al. [1] Table 3, with all measures controlled for individuals’ total brain or intracranial volume. Studies are ordered by sample size from largest to smallest. Bolded study names are those highlighted by DeCasien et al. [6]. Each cell lists effect size (as Cohen’s d-values) for the male-female difference in volume of that cortical region, where “L” indicates left hemisphere, “R” indicates right hemisphere, and the absence of either letter indicates a bilateral measure. Although all of these studies were well-powered, the small magnitude of the differences (≤ 2% of structural volume), divergent methods (image pre-processing, global size correction, and cortical segmentation), and true population differences presumably account for the lack of consistency between them
- Cell shading: pink = significantly larger in females; blue = significantly larger in males; white (n.s.) = not significant
- Abbreviations: ant (anterior); BA (Brodmann’s area); DARTEL (diffeomorphic anatomical registration through exponentiated lie algebra); FDR (false discovery rate); FWE (familywise error rate); HCP (Human Connectome Project, United States); IFG (inferior frontal gyrus); inf (inferior); ITG (inferior temporal gyrus); lat (lateral); MFG (middle frontal gyrus); MTG (middle temporal gyrus); operc (pars opercularis); orb (pars orbitalis); post (posterior); PT (planum temporale); SFG (superior frontal gyrus); SHIP (Study of Health in Pomerania, Germany); STG (superior temporal gyrus); sup (superior); trian (pars triangularis); TTG (transverse temporal gyrus); VBM (voxel-based morphometry)
